A King Tide Storms Ashore
A record-breaking storm sweeps over Calvert Island during one of the highest tides of the year.

It’s no surprise that storm watching has become an established winter activity in parts of coastal British Columbia. Waves tossing huge logs around like matchsticks provides a powerful perspective on the sheer force of nature. However, storm watching is an entirely different beast in remote locations like the Hakai Institute’s Calvert Island Ecological Observatory. High winds and waves can bring daily operations to a grinding halt. With the right instrumentation in place, such events can also lead to some awe-inspiring observations and provide a glimpse into the future as the intensity of storms increases with climate variability.
A low-pressure system delivered hurricane-force gusts as it swept along much of the BC coast on November 17, bringing down trees and knocking out power to tens of thousands of homes. But it was the accompanying storm surge of over half a meter timed nearly perfectly with the peak of a king tide—the highest of high tides—that wowed a grounded field crew on Calvert Island.
Derek Heathfield and a small field crew of researchers were scheduled to leave the field station that day, but luckily for him, the storm delayed their departure. “If they snuck me out that morning, I would’ve been devastated to miss it,” says Heathfield, a geospatial researcher with the Hakai Institute.

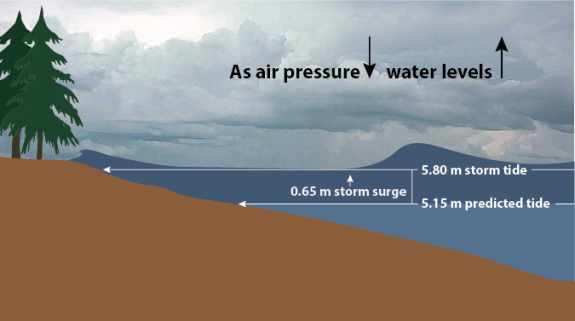
As air pressure over the ocean drops, the sea surface rises—like the mercury in a barometer magnified to the landscape level. With every hectopascal (hPa) drop in atmospheric pressure the sea surface rises by a centimeter, with the potential to form a storm surge. As the storm passed over Calvert Island that afternoon, the rapid drop in air pressure to 969 hectopascals—normal is 1013 hPa—forced a 65-centimeter storm surge within an hour of the expected high tide, delivering a total tide height of well over five meters that submerged the entirety of Hakai’s barge ramp. The shoreline virtually vanished.
“It was one of those rare events where you have such a descent in atmospheric pressure that forces a storm surge paired with a massive king tide,” says Heathfield. “When all those things line up, things get pretty spicy.”
With tide and atmospheric sensors installed on station, Hakai marine instrumentation specialist Jessy Barrette was able to quickly confirm that they were witnessing a convergence of extreme conditions. The drop in atmospheric pressure was the lowest on record since the Pruth Bay weather station was installed over six years ago. The resulting storm surge on top of the king tide pushed the water to its highest level since the permanent tide station was added in March 2018.


On the other side of the island, relatively sheltered from the easterly wind-driven waves, West Beach had also all but disappeared as huge driftwood logs jostled up against the dunes. Just above the beach, a weather station at the nearby lookout measured record gusts of up to 160 kilometers per hour.

While this was a record-breaking event for the weather and tide stations on Calvert Island, Heathfield notes it is a sign of a broader climate pattern. “It’s indicative of a La Niña—that cooler phase of the [El Niño/Southern Oscillation (ENSO)] cycle. La Niña for our part of the coast in British Columbia means more storms, along with more precipitation and cooler temperatures as the jet stream shifts north.”
These records may not stick for long. The ENSO cycle is a key driver of climate variability in the Pacific Northwest, and extreme ENSO events—strong La Niña winters, for example—have become more frequent, a pattern which is predicted to continue. We can expect both the frequency and magnitude of storms and storm surges to increase in turn. With our ever-growing sensor network in place, when bigger storms come along we’ll be there to measure them.

