Mapping Kelp from Space
When it comes to satellite images, resolution isn’t everything.

Take a look at the photos on your phone from five years ago. The quality might be lacking, but these old photos have value. Photos of Earth taken from satellites are similar. While the newest satellites may offer more bells and whistles, it’s one of the classic satellite programs that has Hakai geographer Luba Reshitnyk excited. Where most people see a pixelated tapestry of blue, red, and yellow squares, Reshitnyk sees kelp.
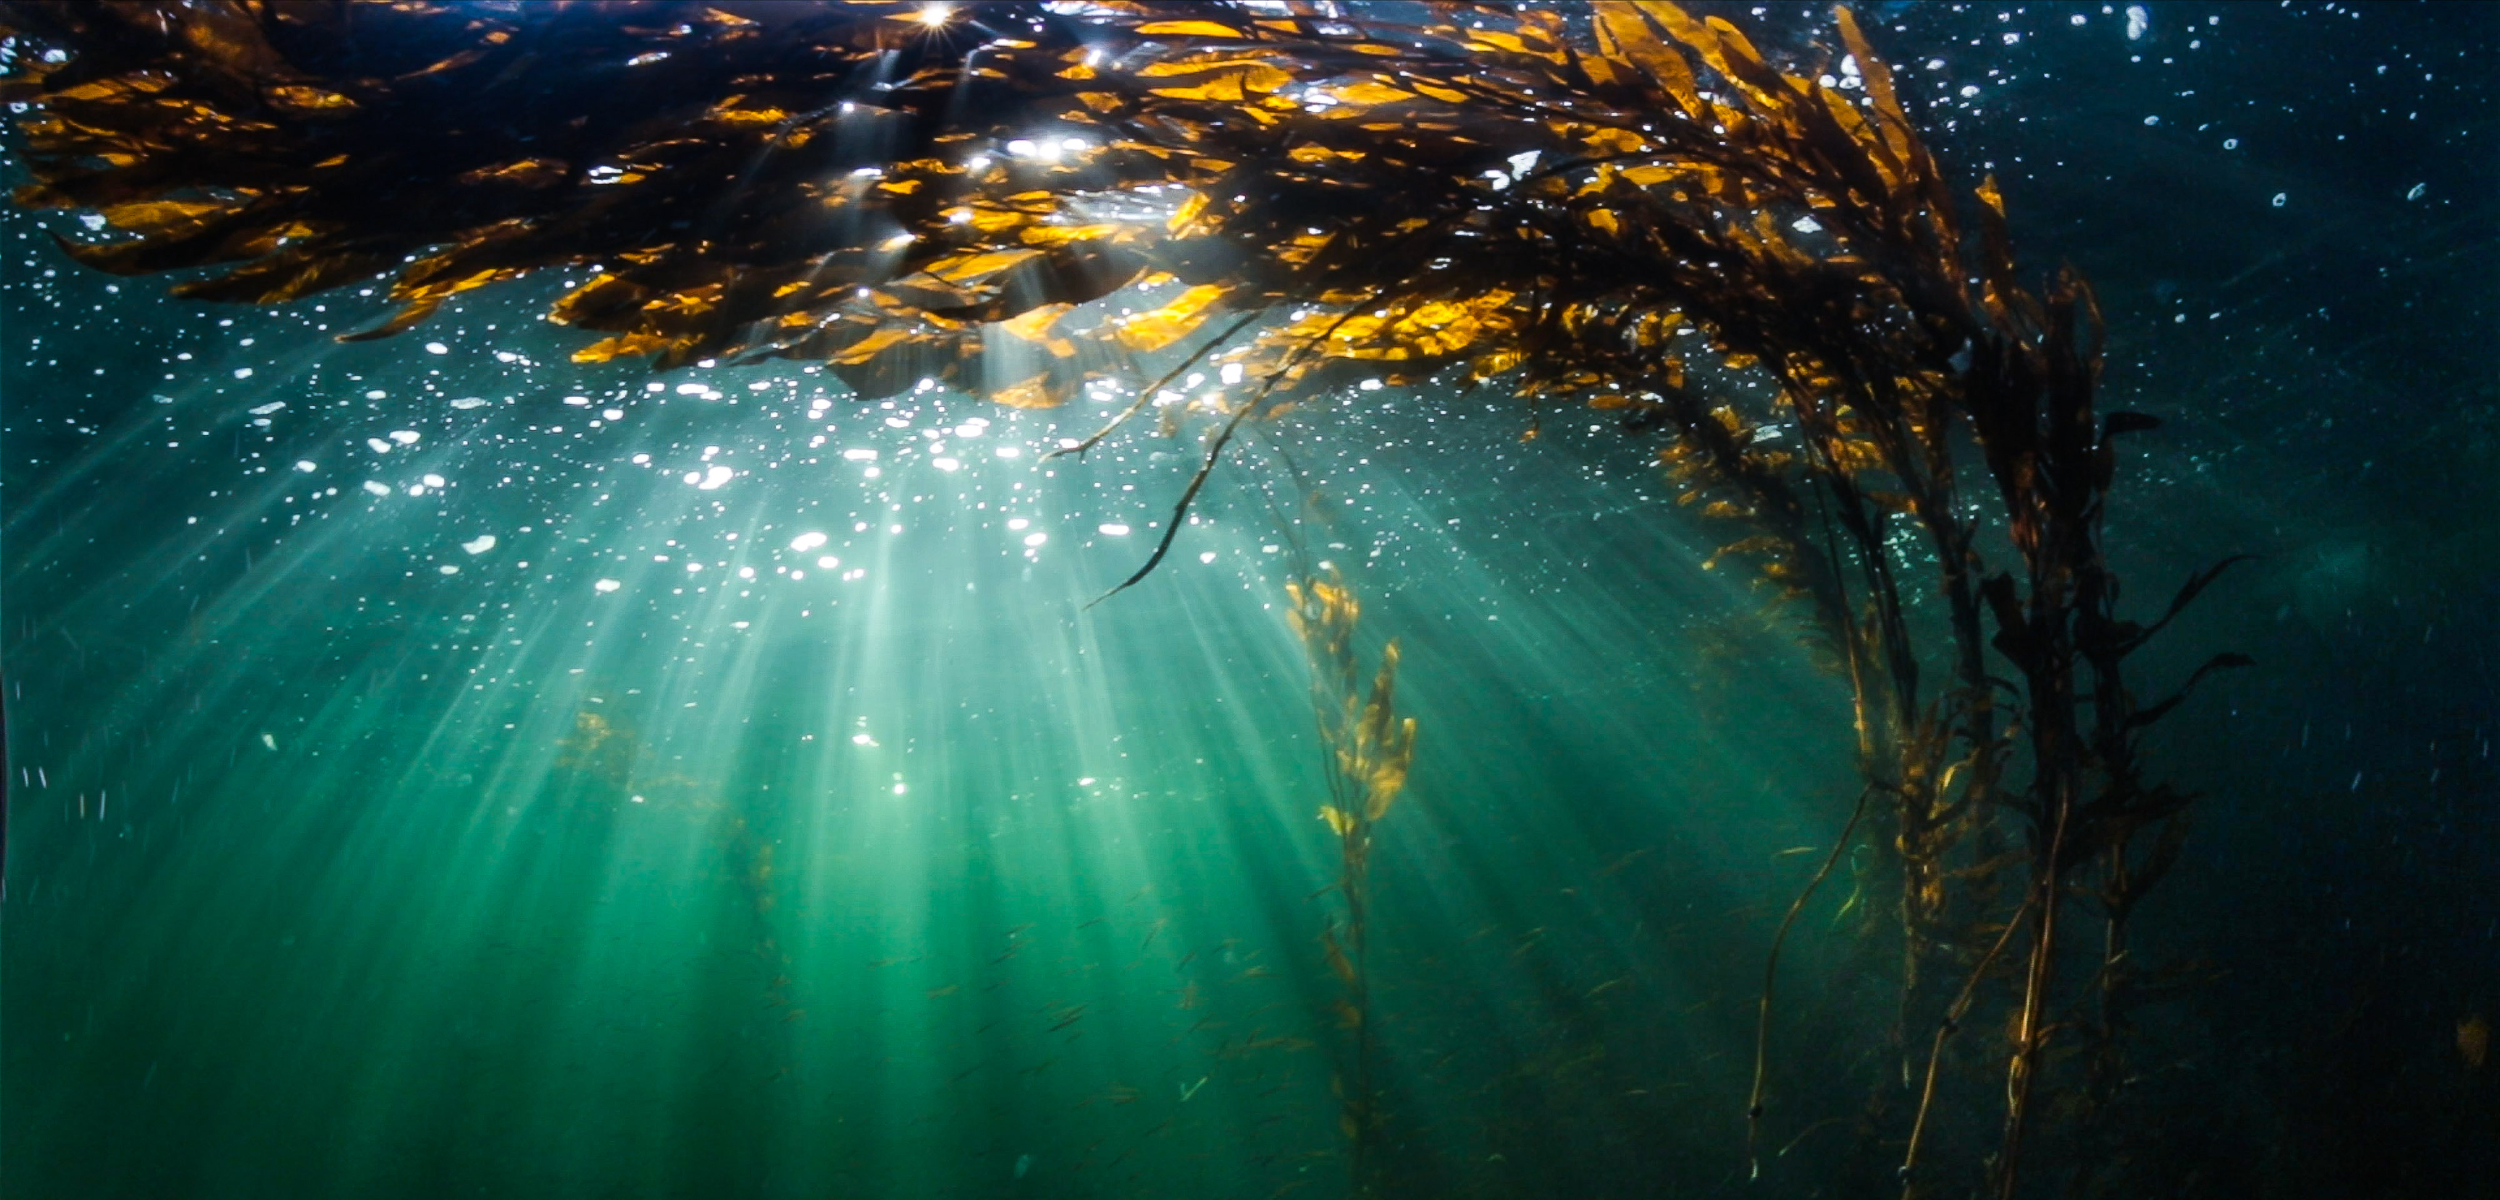
When people talk about kelp in British Columbia, they are usually referring to the two largest, canopy-forming species—bull kelp and giant kelp. These two species form underwater forests that provide shelter and food for myriad species of fish and invertebrates. Humans also harvest kelp for various purposes, including the herring roe-on-kelp fishery, to extract alginates, and for use in cosmetics. Kelp forests fluctuate in size from season to season, so scientists have turned to the skies to track these changes.
“We want to know where is the kelp and how much is there,” says Reshitnyk. “And satellites are one tool we can use to measure that.”
Not all satellites are created equal when it comes to mapping kelp. Each satellite has different equipment and capabilities, so which one is best depends on the question you are trying to answer. There’s often a trade-off between how much area is covered, how often the satellite flies over your area, image resolution, the wavelengths of light it detects, and cost of each image.
Landsat is one such satellite mission that has been imaging the Earth’s changing surface since the early 1970s. Landsat satellites have instruments that can measure near-infrared light. Water absorbs near-infrared light, so the ocean looks very dark in the near-infrared band. Vegetation, including forests on land and kelp forests in the ocean, reflects near-infrared light and therefore looks much brighter than water and provides a nice contrast for mapping kelp. But satellites have their drawbacks too.
“With Landsat satellites, every 16 days you just get what you get,” says Reshitnyk. “You have no control over the weather, the tide, or anything else when it happens to fly over BC.”

Even though not every image is useable (darn clouds!), that still represents thousands of photos since Landsat missions began. So, how do you access and analyze over three decades of Landsat images? Thanks to the Google Earth Engine, a cloud-computing platform with a repository of Landsat images, scientists now have that access. And it’s free.
Researchers from the Hakai Institute, University of Victoria, Department of Fisheries and Oceans, and University of Utrecht devised a tool to automate the detection of kelp within archived Landsat images. They compared their results to a much smaller image archive of the same area from a different satellite, WorldView-2.
What WorldView-2 lacks in historical data sets, it makes up in resolution. Each pixel in a Landsat image represents an area of 30 meters squared. Each pixel in a WorldView-2 image is only two meters squared, which can be further digitally enhanced to pixels that are only half-a-meter squared. A football field in a Landsat image is eight pixels, at most. If the satellite lined up with the field perfectly, a WorldView-2 photo could have up to 1,800 pixels. As a bonus, computer algorithms will soon allow Reshitnyk, and other researchers, to differentiate between the two species of canopy kelp from space, which is not possible with Landsat images.
However, that resolution isn’t free. WorldView-2 is a commercial satellite, owned by DigitalGlobe. For a fee, you can task the satellite to take pictures of a certain area. But costs can soar since higher resolution takes more satellite time to map the same area. With over 25,000 kilometers of coastline in British Columbia, mapping it all would be expensive. Also, factors outside of your control can affect WorldView-2 when you want to task it.
“The biggest issue last summer was with the forest fires and cloud cover,” says Reshitnyk. “The smoke and haze obscured the areas we wanted to capture.”

But resolution isn’t everything. When Reshitnyk and her colleagues compared the two satellites, they found that Landsat could identify kelp as effectively as its commercial cousin 80 percent of the time, despite the coarser resolution. However, Landsat is limited to kelp beds more than 30 meters away from shore.
Satellites are just one tool that Hakai uses to understand the dynamics of kelp forests at large scales. In smaller areas, half a kilometer or less, we deploy drones to map kelp. To map the underwater habitat, scuba divers meticulously measure how much biomass of kelp there is below the water. All of these data combine to give researchers a sense of how and why kelp forests fluctuate from year to year.
“You need decades of data to say that a change in kelp is due to climate change rather than other cyclical factors,” says Reshitnyk. “With Landsat, we have those data.”

